Finally
analytics you
can understand
Analytics shows you what happened, then leaves you to work out what it means. WhereTheyLeave works it out for you and tells you what to fix first.
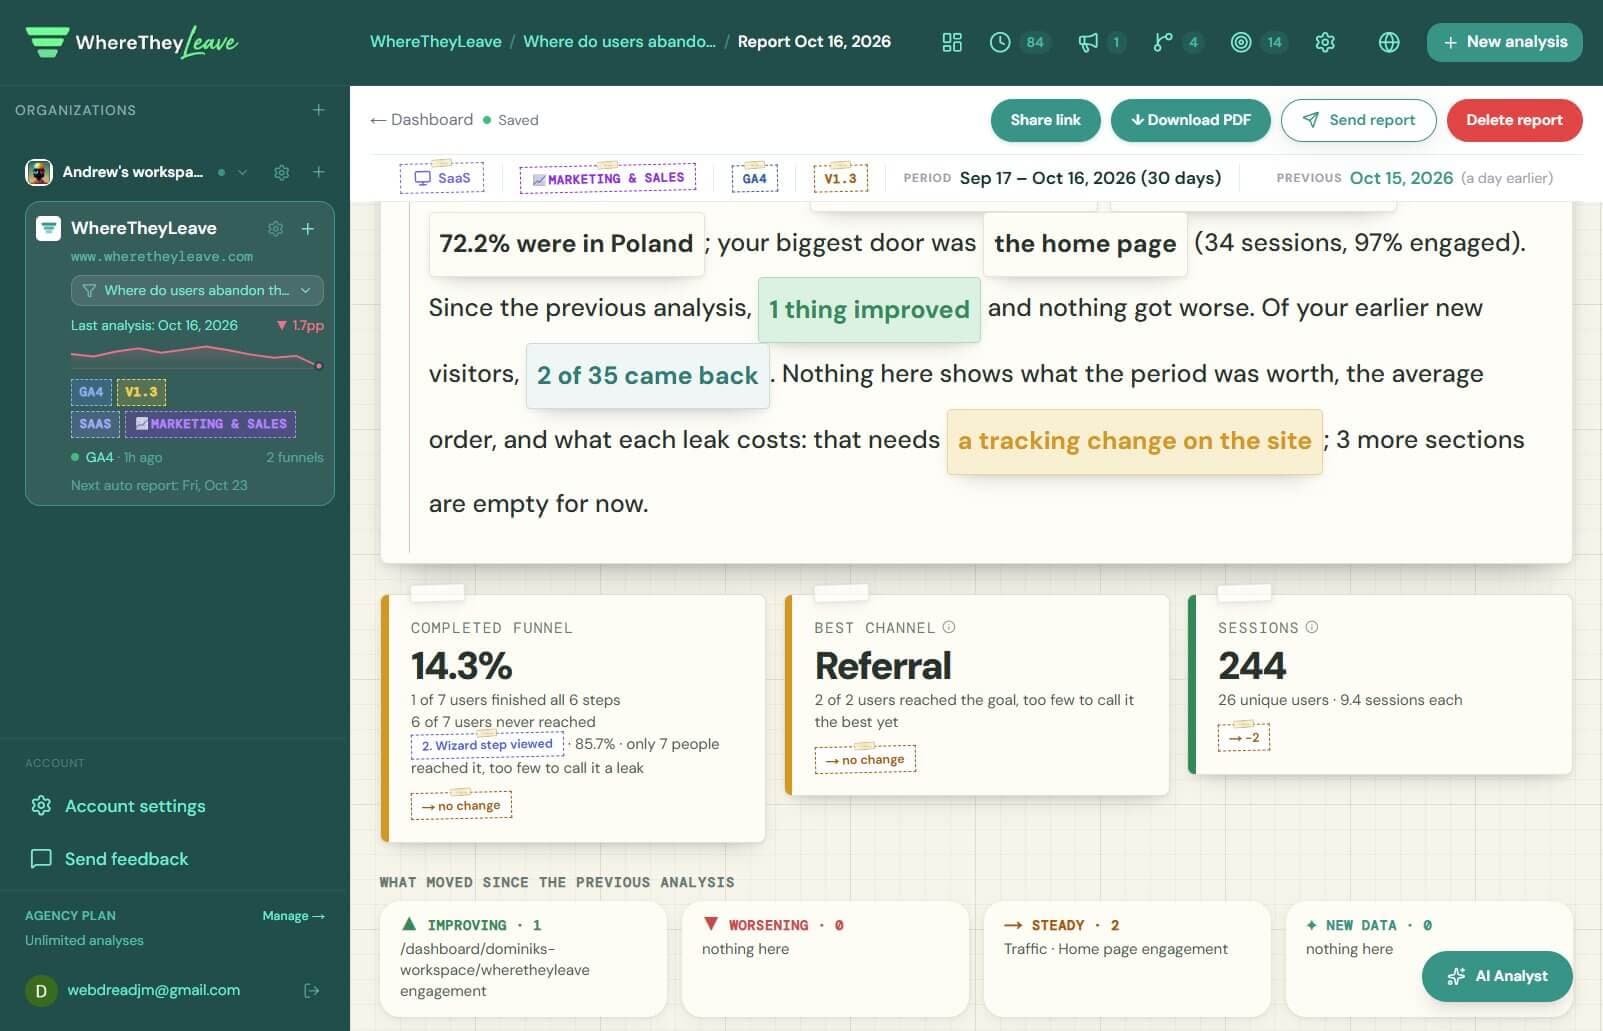
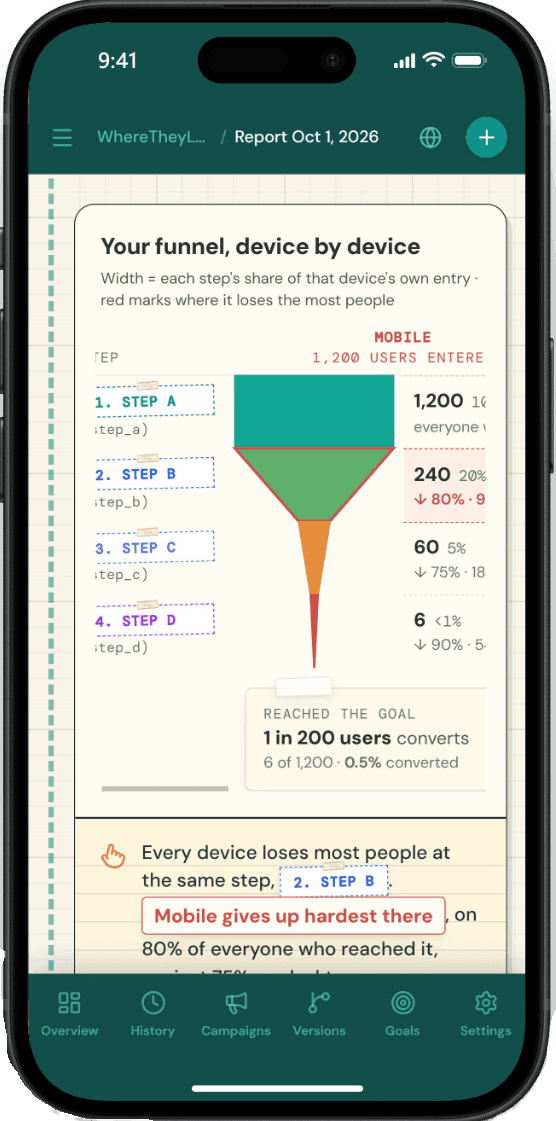
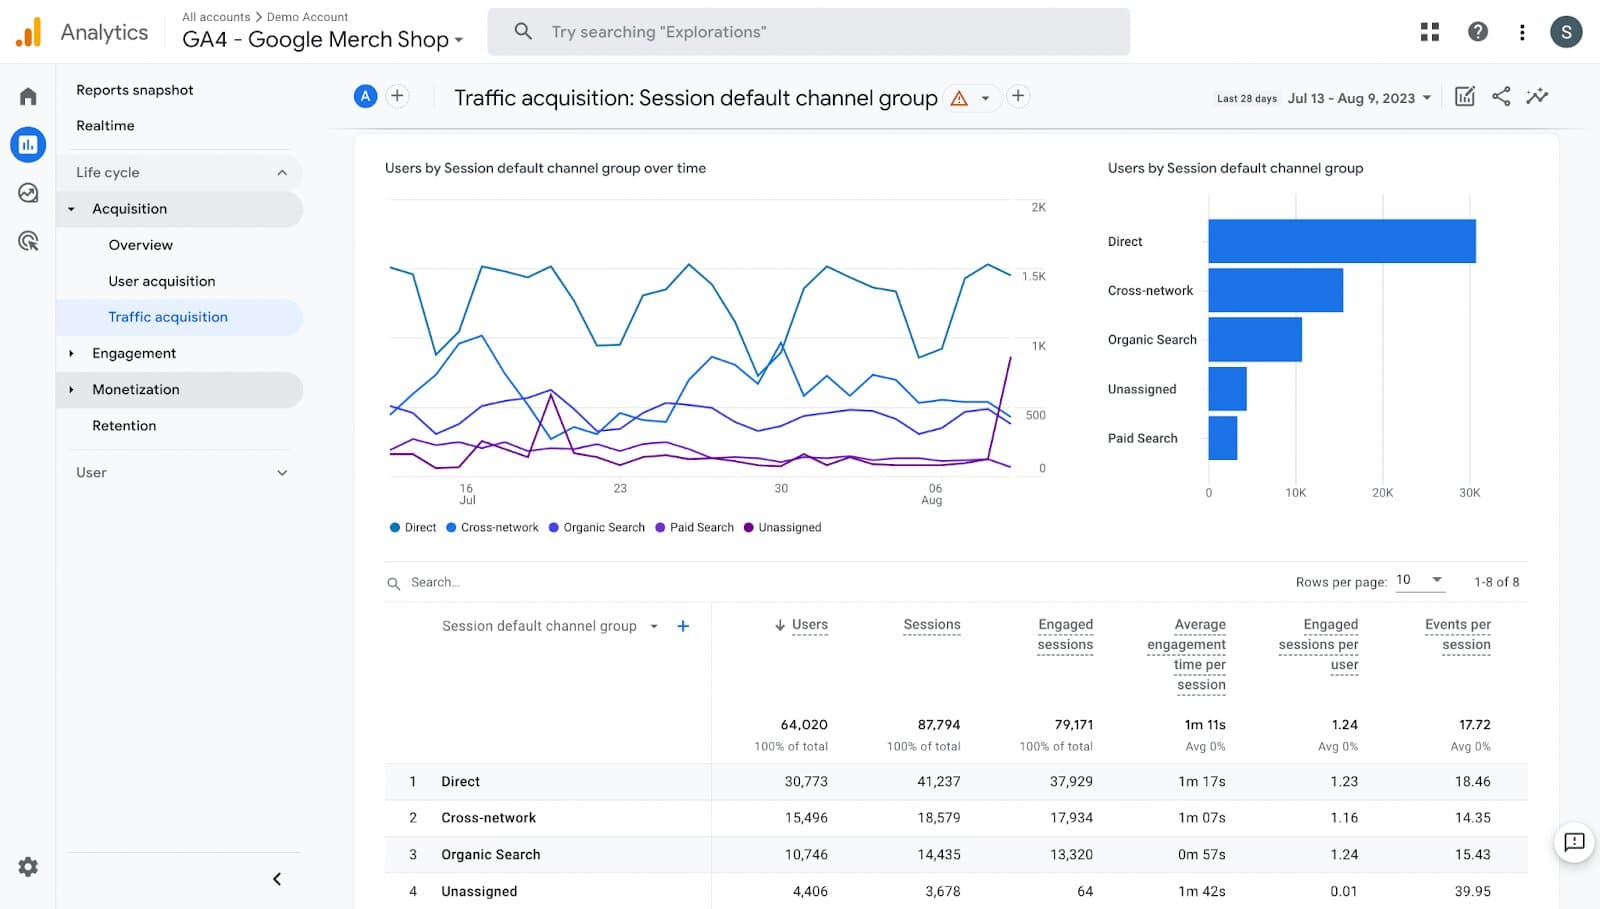
Lots of numbers. No answers.
Thousands of visits, dozens of carts, a few orders. Which step is broken, and is it getting worse? Your analytics has every number. It won't tell you which one matters. WhereTheyLeave reads them for you and answers in sentences: where people leave, what it costs and whether it changed since your last report.
Your analytics · Traffic report
47 reports · 112 metrics · 0 answers
Where do shoppers drop out before buying?
- ▲ +2.1pp · improving
Conversion
9.9% of visitors bought
Biggest drop: 58% leave at 2. add_to_cart · 3 design problems
- ▲ +8% · improving
Visitors
12,400 unique users
17,300 sessions · 1.4 per user
- ▲ +$1,900
Revenue
$30,900
last 30 days
- ▼ −$0.40 · worsening
Google Ads
$2.87 back per $1
$4,549 spent
- no change
SEO
#8 for “wool sneakers”
5,063 clicks · page 1
You changed the checkout on Jun 9.
Since then: +2.1pp conversion and +$1,900. It worked.
The whole picture in one report
Your answers are spread over several tools: traffic, search, ads, page speed. The report reads them together. Where people leave is the first question. Then the pages they saw, what your ads bring back, who buys and whether they come back, and your spot in Google.
Funnel
Benchmarks
Demographics
8.2%
Phone
12.6%
Desktop
Paid ads
$1 → $2.87
$4,549 spent
▼ −$0.40 · worseningSEO
#8
on Google for “wool sneakers”
▲ 3 spots higherRetention
23% come back within 30 days, and they buy 2.1× more often.
Design audit
3 problems on the cart page, touch targets first.
Revenue & products
$30,900
last 30 days
▲ +$1,900Traffic & campaigns
Organic Search 38% · Direct 27% · Paid 7%
▲ +4pp · improvingPerformance
Mobile 81/100
Google counts 90 as fast
Timing
Most buy within 2 days of the first visit.
▲ 1 day fasterWhat to do next
- 1Fix the cart page tap targets
- 2Pause the display campaign
- 3Push “wool sneakers” to top 3
Know which change worked
You update a theme, a price or a campaign, and sales move. Was it the change or just a good week? Mark the change as a new version. From then on, every report compares before and after and says better or worse, or that there is too little data to tell yet.
v1.4 converts 3.8pp higher. The new checkout step paid off.
Can you trust your numbers?
One wrong tracking setting skews every number you decide on: sales with no revenue, your own checkout counted as a referral. Often it shows up months later, when your analytics and your shop disagree. Every report checks your setup, names each gap and says who fixes it. Fix one and a new chapter opens.
Grade C · 3 things to fix
2 are settings in Google Analytics you can change yourself. 1 is a change on your website.
▲ +12 · improvingPurchases arrive without the money on them
18 orders · $0 revenue
Fix: a change on your siteRevenue · lockedYour own domain counts as a referral
pay.northloom.com · 412 sessions
Fix: a setting in GA4Traffic · lockedAd visits arrive without a campaign tag
72% of paid visits
Fix: the links you shareCampaigns · locked
Know where to start
A pile of charts doesn't tell you what to do on Monday. Every report ends with a short list: what to fix first, what each fix is worth and what already works. Every task comes from your numbers. Fix one and the next report tells you if it worked.
Reduce Add to cart dropout
58% of visitors who view a product never reach the 2. Add to cart step, and phones, 61% of your traffic, do worst. Test a simpler, clearer product page against the current one. Google’s test of the page also found 2 design problems, listed separately.
The drop into this step vs 3 days earlier: ▼ +3pp · worsening
≈ $8,400 if mobile matched desktop's buy rate this period
Move budget away from the Display campaign
Display returns the least of your campaigns: at the median campaign's return it would have brought back $1,240 more. Change its targeting or move its budget to a campaign that pays back.
Push “wool sneakers” to top 3
You rank #8 for it with 5,063 clicks. The top 3 results get about 30% of the clicks, and you get 4%. A content push could bring 8× more visits.
every task and number above ↑ is calculated from your data, nothing is guessed. AI only translates them into plain language
It keeps watch for you
A broken checkout or a tag that stops firing often shows up weeks later, by chance. Your report lands in your inbox every week or month. An alert comes as soon as your data shows conversion dropping, usually the next day. Share any report as a link or PDF, with your team or a client.

Northloom Apparel · weekly · Jun 9–15
Your funnel report
Where do shoppers drop out before buying?
Completed funnel
9.9%
▲ +2.1ppBest channel
3.8× Paid Social
Sessions
17,300
- 1. Product page100%
- 2. Add to cart42%
- 3. Checkout22%
- 4. Purchase9.9%
▼ Conversion drop
Northloom Apparel · last 30 days
Conversion dropped 25%
Now
7.4%
Previously
9.9%
Biggest leak: Add to cart · 58% drop-off
▲ SEO rise
Northloom Apparel · Google search
1 keyword entered Google's page 1
Weekly digest · last 7 days
Visitors up 12% this week
Northloom Apparel
Unique visitors
2,893
▲ +12%Sessions
4,037
▲ +9%Northloom Apparel · milestone
Goal achieved!

Goal
10%
Achieved
10.6%
🎯 Your next goal is already set.
Before you connect
The questions we hear most.
I already have analytics. Why do I need this?
Your analytics has the data. WhereTheyLeave reads it for you and says in plain words what's happening and what to do.
Is this another analytics tool, like Matomo, Umami, Clarity, Mixpanel or PostHog?
No. Those tools collect data: you add their script to your site, then read their dashboards yourself. WhereTheyLeave has nothing to install and collects nothing. It reads the analytics you already have and tells you in plain words what it means and what to fix first. Already use one of them? Keep it. It counts your visits. WhereTheyLeave doesn't count, it explains, today from Google Analytics.
I rarely look at analytics. Is this for me?
That's who it's for. A report arrives by email every week or month, and an alert comes when conversion drops.
Can I trust the numbers, and the AI?
Code calculates every number and verdict from your data, and AI only puts them into words. When there are too few visitors to judge, the report says so.
Is my data safe?
Access is read-only, and we keep the finished report, never your raw data. Nothing new runs on your site, so there's no new cookie banner.
Start finding answers
Connect your analytics and get your first report in about a minute. No card needed.
Works with Google Analytics, Search Console and Google Ads.